

Grafana
Grafana
Description:
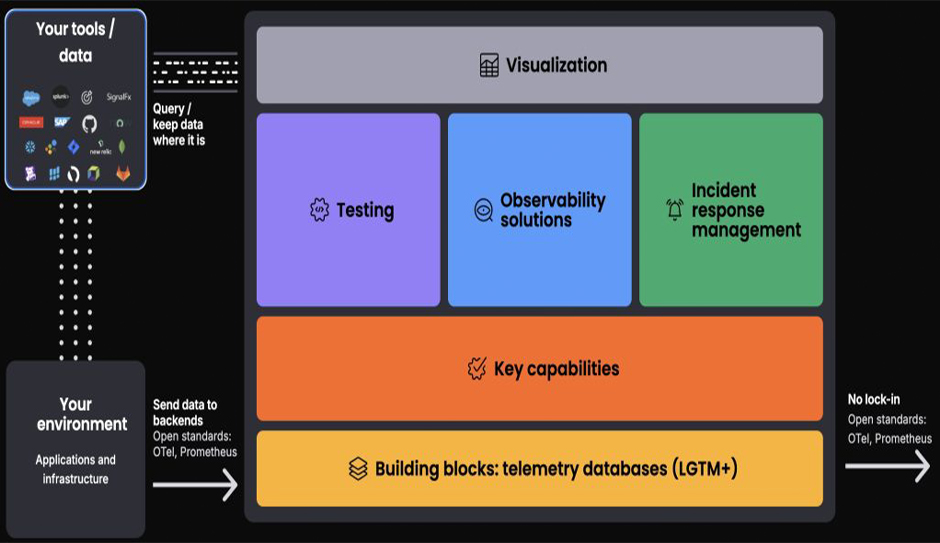
Grafana is the open source analytics & monitoring solution for every database.
Features
Accelerate Root Cause Analysis
Contextual alerts integrated into Grafana Cloud workflows for applications, Kubernetes, and infrastructure observability help teams identify and resolve issues faster while improving operational efficiency.
Optimize Metrics and Log Volumes
Powered by machine learning, Adaptive Telemetry intelligently aggregates unused metrics and optimizes log volumes, helping organizations reduce costs and improve time series efficiency and cardinality management.
Unified Incident Response Workflows
Manage alerts, SLOs, on-call schedules, incident response, and postmortem analysis directly within Grafana Cloud, enabling faster collaboration and more effective issue resolution.
Related Products


vCluster
Create & Manage Tenant Clusters Like a Hyperscaler

Tonic
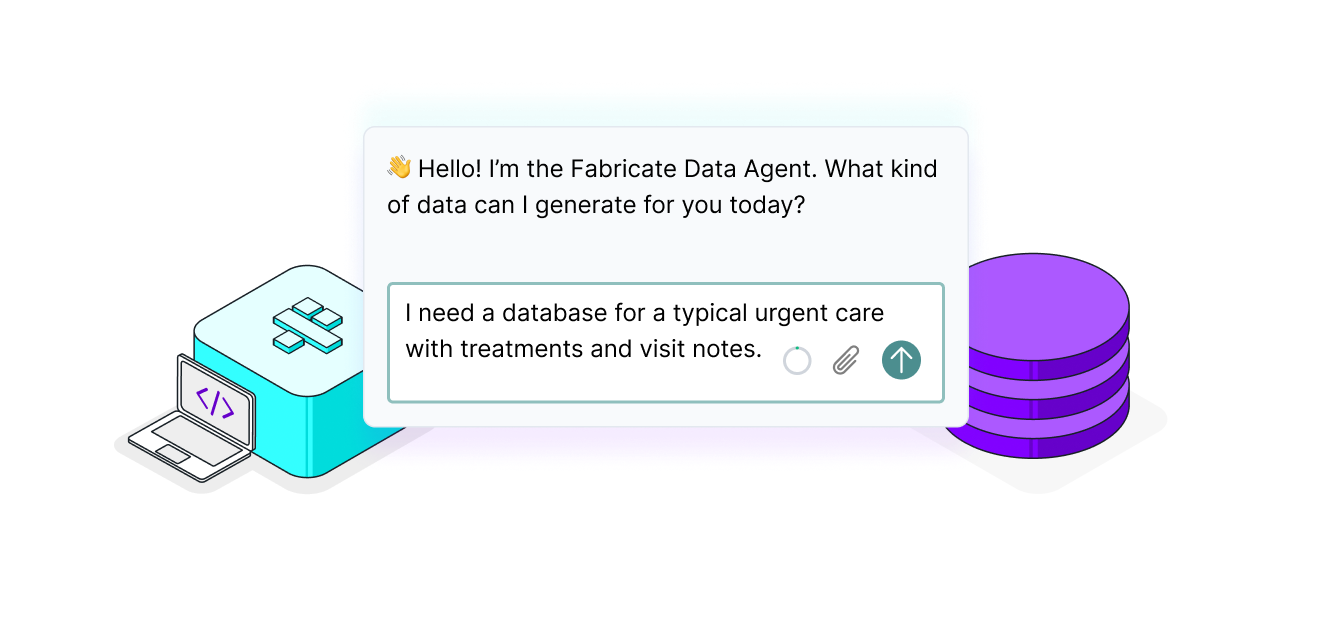
Unblock AI training, development, and testing workflows with safe, realistic synthetic data from your producti...

Kaseya
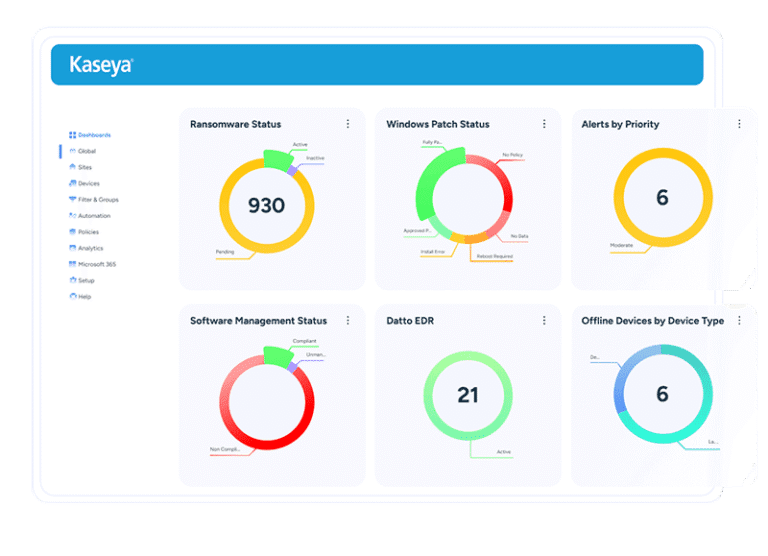
Kaseya Intelligence powers a unified platform that transforms how MSPs and businesses operate, secure and grow...